If you own an industrial RO system you have likely looked at the drain pipe and wondered how much good water is going down it. It all comes down to one number: the RO recovery rate.
Setting the recovery rate appropriately can reduce feed water consumption, but pushing it too high can increase the risk of membrane scaling and raise operating costs. In this guide, we’ll explain how RO recovery rate works, how to calculate it, what affects it, and how to tell whether your system is operating within a reasonable range.
What RO Recovery Rate Means for Your System
RO recovery rate is the percentage of feed water that becomes permeate, or product water. The remaining is sent away as concentrate, carrying with it the salts and contaminants rejected by the membrane. Basically, it shows you how efficiently the system uses the water it receives.
There’s no single “right” number. A system with hard, silica-rich feed water may have to operate at a low recovery whereas one with clean, well-pretreated feed water can operate significantly higher. The optimum target varies with the feed water, type of membrane and system configuration therefore copying a number from another plant seldom works.
How to Calculate RO Recovery Rate
The formula is simple:
Recovery rate (%) = Permeate flow ÷ Feed flow × 100
Feed flow is permeate flow plus concentrate flow.
For example, an industrial RO system takes in 10 m³/h of feed water and sends 3 m³/h to drain as concentrate. That means permeate is 7 m³/h.
- Recovery rate = 7 ÷ 10 × 100 = 70%
- Concentration factor = 1 ÷ (1 − 0.7) ≈ 3.3
That second number counts. At 70% recovery the salts in the concentrate are concentrated to around 3.3 times the feed. To obtain accurate findings, take readings of the permeate and concentrate flow meters simultaneously, during steady-state operation.
Why a Higher RO Recovery Rate Isn’t Always Better
There is a temptation to keep boosting it because higher recovery implies less water wasted. But each incremental percentage point makes the concentrate saltier, especially toward the end of the system. This leads to a number of trade-offs:
- Scaling risk: Minerals such as calcium carbonate and silica can reach their solubility limit and scale on the membrane.
- Higher energy use: A saltier concentrate equals more osmotic pressure therefore the pump has to work harder.
- Lower permeate quality: Higher recovery increases salt concentration in the feed channels, which can increase salt passage under some operating conditions and affect permeate quality.
- Shorter membrane life: More fouling and scaling means more cleaning. Cleaning wears down membranes.
High recovery is still achievable. With robust pretreatment, proper scale control and a well thought out staging design many systems may run at high recovery safely. The key is to design and operate the system for high recovery, rather than simply closing a valve to increase the recovery rate.
What Affects RO Recovery Rate
1. Quality of feed water
The upper limits are hardness, silica, TDS, organics and suspended solids. The main factors limiting recovery are membrane fouling and scaling.
2. Pre–treatment
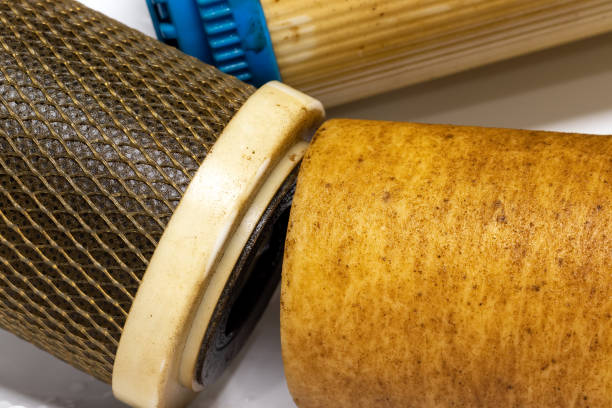
Good filtration, softening, antiscalant dosing and dechlorination help to maintain the membrane cleaner, making safer recovery possible. Systems often have trouble if this step is omitted.
3. Membrane condition
Fouling, scaling, or chemical damage can reduce membrane performance and permeate flow. Depending on how the system is operated, these changes may also affect the achievable recovery rate.
4. System design and operating conditions
Staging, recirculation of concentrate, pressure of feed, temperature, valve settings all play a factor. Operation outside the design pressure range of the membrane can cause damage.
How to Tell If Your RO Recovery Rate Is on Track
- Compare with the design value. Your system datasheet lists the intended recovery rate. A persistent gap between the actual and design recovery rates is worth investigating.
- Check feed water and scaling potential. When the feed changes, say with a change of season or a new water source, the safe recovery limit changes too.
- Monitor flow and pressure changes. Fouling or scaling may become apparent through declining permeate flow, increasing pressure drop, or deteriorating permeate quality before the recovery rate changes significantly.
- Adjust only with support from the data. Only raise the recovery if pretreatment, scaling calculations, and membrane restrictions all permit. Make little modifications. Then watch.
RO recovery rate is a trade-off between water conservation and membrane protection. If you know how to calculate it and know what moves it, it’s a lot easier to recognise problems early and establish a reasonable aim.
At Molewater, we design industrial reverse osmosis systems with pretreatment and staging matched to each customer’s feed water. If you are unsure whether your recovery rate is where it should be, contact us to discuss your project.