
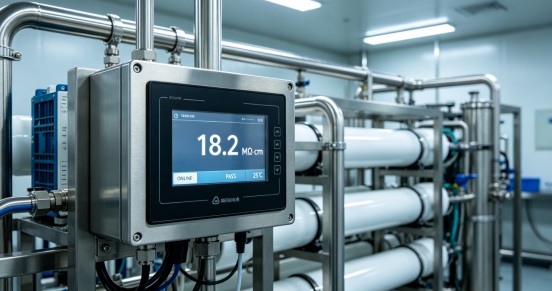
A resistivity reading that used to sit near 18 MΩ·cm but is now sliding downwards is among the most frequent — and frustrating problems for laboratory managers and plant operators. The reason for this isn’t always clear since the drop can occur anywhere along the treatment pathway, including sources of water supply, the purification stage as well as the storage loop or even the instrument that reads it. In the next sections, we will go through the most frequent causes, roughly in the order water actually flows through a system, which will help you narrow the issue quicker.
What Does Ultrapure Water Resistivity Actually Tell You?
Conductivity and resistance both measure exactly the same things, but from opposite directions, namely the quantity of the dissolved ions present in water. At 25 °C, pure water has a theoretical maximum resistance of 18 MΩ·cm and ultrapure systems that are well-maintained regularly exceed this level in actual. This ceiling isn’t a marketing number — it’s set by water’s own dissociation equilibrium, meaning no system can exceed it under normal conditions.
That’s why resistivity is such a reliable proxy for purity across regulated industries. Pharmaceutical water is required to meet a Stage 1 conductivity limit of 1.3 µS/cm under USP <645>, while sub-7nm semiconductor fabs typically target the full 18.2 MΩ·cm at the point of distribution, often paired with a TOC limit below 1 ppb. Any sustained drop below your process’s baseline is a signal worth investigating — not just an inconvenient number on a screen.
7 Common Causes Behind Falling Resistivity
1. Feed Water Quality Has Changed
Source water isn’t static. The shifts that occur in the seasons, the fluctuations of well-water or changes in municipal treatment could increase the amount of TDS that enters your system. A pretreatment stage sized for one water profile may struggle when the incoming load increases, pushing more ions downstream than your polishing stage was designed to handle.
2. RO Membrane Fouling or Scaling
Membranes for reverse osmosis are able to eliminate the majority of the dissolved salts before the water reaches the final polishing. When membranes become contaminated by organic matter or become clogged by minerals of hardness salt rejection efficiency diminishes and RO permeate performance decreases. Since most ultrapure systems rely on RO as the first major purification stage, a fouled membrane places extra ionic load on everything downstream.
3. EDI Module or Ion Exchange Resin Is Exhausted
Electrodeionization (EDI) module and mixed-bed ion exchange resins are the elements most accountable for achieving megohm-level resistance. Resins are prone to exhaustion when they are used. EDI modules are susceptible to fouling or increase in size with time, particularly when the RO performance of upstream RO has already deteriorated. Because this stage does the final ionic polishing, its condition often has the single largest effect on your resistivity reading.
4. CO2 Intrusion from the Atmosphere
It’s not difficult to overlook as it’s not a “failure” in the mechanical sense — it’s actually chemistry. Once ultrapure water has been exposed to the air, it starts taking in carbon dioxide from the air and creates carbonic acid, which immediately decreases resistance. Breathing vents and sample points that are not sealed points are all common entry points. Highly resistive waters are naturally unstable in the open space, that’s the reason the majority of ultrapure systems test resistivity using an in-line probe, instead of using the grab of samples.
5. Microbial Growth in Storage or Distribution Loops
Low-flow zones and dead legs in storage tanks or distribution piping create ideal conditions for biofilm formation. Beyond the bioburden risk this poses for regulated applications, microbial activity introduces ionic byproducts and organic material into the water — both of which register as a resistivity decline even if every upstream component is functioning correctly.
6. Leaks, Dead Legs, or Cross-Contamination in Piping
A broken check valve, a damaged fitting or a poorly-designed loop could let water of lower purity mix with an ultrapure water stream. Since these leaks are usually very small and infrequent, they’re among the most difficult causes to identify without systematically separating sections that are part of the distribution network to conduct tests.
7. Sensor Drift or Fouling (It Might Not Be the Water)
Resistivity is temperature-dependent — uncompensated readings can swing from roughly 86 MΩ·cm near 0°C down to about 1.3 MΩ·cm near 100°C for otherwise identical water, so a probe without proper temperature compensation can report a false decline. Sensor fouling and calibration drift produce the same effect. Before assuming the water itself has degraded, it’s worth confirming the instrument reading it hasn’t.
How to Systematically Diagnose the Root Cause
Rather than replacing components one at a time, work through the system in a logical sequence:
- Verify the instrument first. Check calibration, temperature compensation, and probe cleanliness — ruling out the meter takes minutes and prevents unnecessary part swaps.
- Check the point closest to use. Sample directly at the point of use versus upstream of storage. A gap between the two often points to CO2 ingress or biofilm in the distribution loop.
- Work backward through the treatment train. Test RO permeate quality, then feed water TDS, to see whether the ionic load entering the system has simply increased.
- Inspect the polishing stage last. If feed water and RO performance are both within normal range, the EDI module or resin is the most likely remaining cause.
When Troubleshooting Isn’t Enough: Signs You Need a System Upgrade
Frequent manual troubleshooting, repeated EDI servicing, or chemical regeneration cycles are often signs that a system’s automation and design have fallen behind its operating demands — not just signs of a single failed part. Systems that combine double-stage RO with EDI, such as Molewater’s ultrapure water system, are built to avoid several of these failure points structurally: continuous electrodeionization eliminates the acid/alkali regeneration chemistry that introduces handling risk and downtime, while PLC-based automatic control with online resistivity and conductivity monitoring catches deviations before they become production problems. For facilities seeing recurring resistivity issues rather than a one-off event, evaluating whether the underlying system design — not just its consumables — is still matched to current demand is often the more productive question.