In most modern analytical labs, choosing the right grade of lab water is not only a compliance thing, it’s a critical variable that affects reproducibility in real life. And sure, people spend hundreds of thousands of dollars on shiny chromatography and mass spectrometry gear, but the chemical cleanliness of the water feeding those instruments is often treated like an afterthought. If you don’t clearly separate Type 1 ultrapure water from Type 2 pure water, it can quietly ruin data integrity, wear down expensive components, and even help create those oddly persistent “ghost peaks” that show up in your baselines, like nothing is wrong. Here we lay out the properties of Type 1 and Type 2 water , and we explain why precision methods such as HPLC and ICP-MS really require ultrapure water.
What Defines Type 1 and Type 2 Purity?
To build a more rigorous workflow framework , standards bodies—like ASTM D1193 from the American Society for Testing and Materials and ISO 3696 from the International Organization for Standardization—sort laboratory water into different levels. They do it based on measurable physical and chemical features.

The Theoretical Limit: Type 1 Ultrapure Water
Type 1 water is basically the top tier of purification engineering, it only really makes sense when the water is stripped of almost all ionic bits, organic residues, and microbial stuff. You can spot it by a clearly stated electrical resistivity value of 18.25 MΩ·cm at 25°C, which is often treated as the absolute maximum you can reach for chemically pure water because of water’s own self-ionization. Also Type 1 water needs the Total Organic Carbon , or TOC, to stay under 5 ppb (parts per billion) and bacteria should be below 1 CFU per mL. On top of that endotoxins must be below 0.03 EU/mL.
The Workhorse Grade: Type 2 Pure Water
Type 2 water, sometimes called analytical-grade or deionized (DI) water, sits in that middle tier classification. It holds an electrical resistivity somewhere between 1.0 and 15.0 MΩ·cm at 25°C. With Type 2 systems, reverse osmosis plus routine deionization resin beds handle most of the bulk inorganic ions, pretty reliably. But the rules are a bit more forgiving for trace elements and organic molecules, so the TOC usually lands around 10 to 50 ppb, not as tightly controlled.
HPLC Analysis: Why Carbon Contamination is Your Column’s Enemy
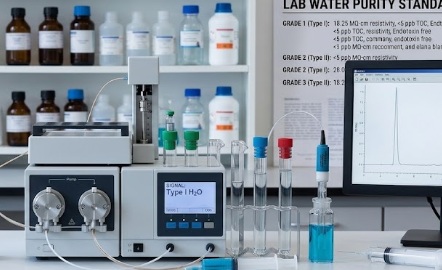
HPLC, also known as High Performance Liquid Chromatography (HPLC) and Ultra-High Performance Liquid Chromatography (UHPLC) depend on the exact distinction of chemicals in a stationary phase column pressurized. Because water is the primary solvent for mobile phase in reversed-phase HPLC Any background contaminants can directly affect the mass-selective or opto-optical detectors downstream.
The Mechanism of Column Fouling
If the trace organic pollutants (measured by TOC) are present in the reservoir for mobile phase it is not enough for them to disappear into the system. In reversed-phase chromatography the stationary component is extremely fluid (typically C18 bonded silica). Organic impurities that are present in lower-grade Type 2 water act exactly as target analytes. They attach strongly to hydrophobic stationary sites within the aqueous phase of the gradient elution.
When the concentration of organic solvent grows throughout the course the impurities that are trapped in the background disintegrate in different ways. This physical phenomenon manifests in the chromatogram as baseline drifting, significant disturbance, as well as the appearance of “ghost peaks”–spurious non-replicable spikes that are reminiscent of real analytes, but compromise the accuracy of quantitative analysis.
Protecting Your Stationary Phase
Over and above baseline distortion extended exposure to organic loads of Type 2 results in irreparable fouling of columns. The macromolecules block the pores of sub-2 micron of specially designed UHPLC columns, creating localized pressure spikes that could cause ruptures in the seals of the system. To create a flat UV baseline at wavelengths with sensitive properties (such as 254 nm or 210 millimeters) Type 1 water that is processed with dual-wavelength (185 /254 nm) UV photo-oxidation is mandatory to reduce trace organics to the polar species that do not build up in the columns.
ICP-MS Testing: Eliminating Parts-Per-Trillion (ppt) Background Noise
Inductively Coupled Plasma Mass Spectrometry (ICP-MS) is an ultra-trace method of analysis for elements capable of analyzing non-metals and metals at parts-per billion (ppb) all the way to parts-per-trillion (ppt) amounts. At this high degree of sensitivity, the instrument is unable to distinguish between elements derived from a biological specimen and an element extracted from the laboratory water matrix that is used for blank preparation and sample dilution.
The Issue With Mineral Slippage
Type 2 deionized systems typically display “silica slippage” or allow trace mineral ions, such as Sodium (Na+) Magnesium (Mg2+) as well as Calcium (Ca2+) to move through when resin beds near exhaustion. In typical medical or environmental workflows these micro-traces do not pose any risk. In an ICP-MS sampling matrix prepared by using Type 2 water will yield huge amounts of elemental signal count.
The increased background signal damages the instrument’s ratio of signal to noise artificially increasing the Method Detection Limit (MDL) and making statistical quantification of ppt levels impossible.
Preventing Isobaric Interference
Furthermore, elemental impurities in the water matrix create complex polyatomic ions within the high-temperature argon plasma chamber. For instance, trace carbon or mineral isotopes can combine with plasma gasses to create isobaric interferences, blocking the mass-to-charge ($m/z$) channels of critical target analytes (such as ArC⁺interfering with Chromium tracking).
Feeding an ICP-MS requires a dedicated Type 1 system equipped with high-grade, virgin nuclear-grade polishing resin and terminal ultrafiltration filters (0.05-micron pores) to completely eliminate particulate mineral slippage.
Technical Comparison Matrix for Lab Operations
The following data matrix provides the exact physical criteria that separate water grades, and their clear connection to laboratory hardware accepted in CLSI (Clinical and Laboratory Standards Institute) protocols:
| Water Purity Parameter | Type 1 Ultrapure Water | Type 2 Pure Water |
| Resistivity at 25°C | 18.25 MΩ · cm (Fixed limit) | 1.0 to 15.0MΩ · cm |
| Total Organic Carbon (TOC) | > 5 ppb (Typically 1 to 3 ppb) | < 50 ppb |
| Bacterial Contamination | < 1 CFU/mL | < 100 CFU/mL |
| Endotoxin Content | < 0.03 EU/mL | N/A |
| Particulates (> 0.22 mm) | < 1 particulate/mL | N/A |
| Primary System Mechanics | Dual UV oxidation and nuclear resin polishing | Multi-stage RO Standard EDI or DI beds |
| Mandatory Instrument Alignments | HPLC, UHPLC, ICP-MS, GC-MS, Mammalian Cell Culture | Autoclaves, Glassware Washers, Buffer Prep |
Optimizing Your Lab Workflow with Molewater
Implementing an efficient water purification architecture requires a balanced approach. Producing Type 1 ultrapure water continuously for bulk applications like glassware washing is economically inefficient due to the wear on high-cost polishing cartridges. Conversely, utilizing Type 2 water for advanced analytical instrumentation risks data rejection and hardware failure.
The optimal infrastructure configuration involves a dual-stage setup: utilizing a centralized system to produce Type 2 water for general utility, which then acts as the direct feed source for localized polishing units that generate fresh Type 1 water on demand. This approach prevents the water from re-absorbing atmospheric carbon dioxide , which rapidly degrades resistivity when ultrapure water is stored in open carboys.
By integrating primary reverse osmosis, continuous electrodeionization (EDI), and terminal ultra-purification configurations with real-time resistivity and TOC monitoring, Molewater ensures that your HPLC mobile phases and ICP-MS calibration blanks remain free of trace interference.